
ETF Creation Redemption Tracking
Physical Full Replication vs Stratified Sampling in Bond ETFs: Cell-Matching Optimization
While 40-issue U.S. Treasury ETFs hold 100% of index constituents via full replication, broad aggregate and corporate bond ETFs use stratified cell-matching across duration, OAS, and issuer tiers to track 13,000+ CUSIPs within 2 bps.
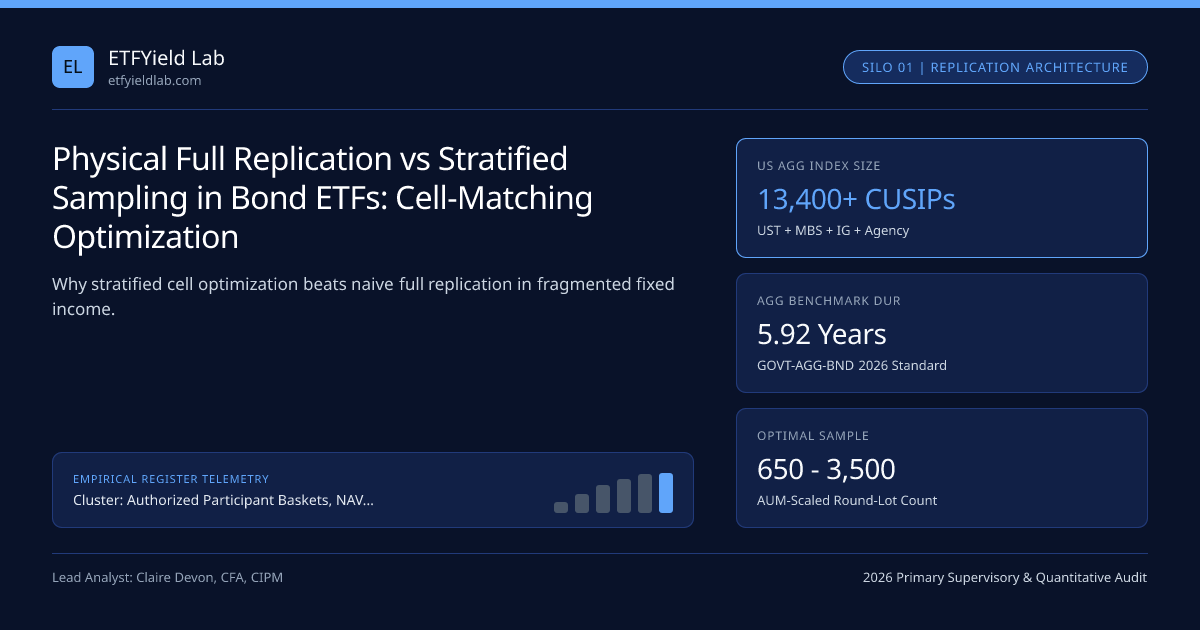
In large-cap equity indexing, full physical replication is the undisputed gold standard: an S&P 500 ETF buys all 503 constituent stocks in exact float-adjusted market-capitalization weights. Apply that identical rule naively to the Bloomberg U.S. Aggregate Bond Index—monitored under our Core Aggregate Bond ETFs (GOVT, BND, AGG) 2026 Standard—and portfolio returns collapse. Because a corporate issuer like AT&T or JPMorgan Chase may have 45 separate senior unsecured bond CUSIPs outstanding across staggered maturities while thousands of off-the-run issues sit locked in insurance vaults, fixed income ETFs achieve superior net tracking through multi-dimensional stratified sampling.
Within our Authorized Participant & Tracking Hub and SEC Rule 6c-11 AP Custom Baskets Guide, understanding when full replication excels versus where stratified cell-matching dominates clarifies the tracking metrics analyzed in ETF tracking difference vs tracking error.
Multi-Dimensional Cell Partitioning in Fixed Income#
Stratified sampling divides a broad fixed income benchmark into $M$ mutually exclusive, collectively exhaustive risk cells across five structural axes:
- Asset & Sector Class: U.S. Treasury, Agency Bullet, Agency MBS pass-through, Industrial IG, Utility IG, Financial IG, Sovereign/Supranational.
- Key-Rate Maturity / Duration Bucket:
1-3Y,3-5Y,5-7Y,7-10Y,10-20Y,20Y+partial DV01s (calculable via our Bond yield & duration calculator). - Credit Quality & DTS Tier:
AAA,AA,A,BBB+,BBB,BBB-matched on Duration Times Spread (DTS). - Optionality & Coupon Convexity: Non-callable bullet vs make-whole call vs par-callable / MBS coupon cohort.
- Issuer Cap: Bounding single-obligor weight deviation (
|w_ETF,issuer - w_Index,issuer| <= 15 bps) to eliminate idiosyncratic fallen-angel jump risk.
The Transaction-Cost vs Sampling-Error Frontier Formula#
Why not sample just 30 bonds? Because under-sampling inflates idiosyncratic credit risk (TE_idiosyncratic). Why not buy all 13,400 bonds? Because over-replication inflates illiquid execution drag (C_illiquidity). Portfolio construction solves for the global minimum of total shareholder cost:
- TotalPenalty(N) = CTurnoverDrag(N) + (LambdaRisk / 2) * [ TEFactor^2 + (SigmaIdio^2 / N_eff) ]
- Where:
- Neff = 1 / Sum(wissuer^2) [Effective number of independent credit obligors]
- CTurnoverDrag = AnnualIndexTurnover * AvgHalfSpread(N)
- Worked $500M Investment-Grade Bond ETF Optimization (Annual Index Turnover = 18%):
- Strategy 1 (Naive 3,400-Bond Full Replication): Avg Half-Spread = 28 bps -> Drag = -5.04 bps/yr | TE = 2.5 bps
- Strategy 2 (Too-Thin 60-Bond Sample) : Avg Half-Spread = 5 bps -> Drag = -0.90 bps/yr | TE = 38.0 bps!
- Strategy 3 (Stratified 680-Bond Cell Sample) : Avg Half-Spread = 7 bps -> Drag = -1.26 bps/yr | TE = 5.8 bps
- > Stratified 680-bond sample saves +3.78 bps/yr in net yield while holding TE inside institutional tolerances!
Notice how seamlessly stratified sampling pairs with SEC Rule 6c-11 custom basket policies: whenever an ETF is underweight the 7-10Y BBB Telecom cell by $4 million, the portfolio manager simply lists liquid Verizon or T-Mobile 8-year notes in tomorrow morning's custom creation basket so APs deliver the exact missing cell free of secondary brokerage commissions!
Constituent Coverage Ratios Across Fixed-Income Benchmarks#
Comparing Replication Methods Across U.S. & UCITS Fixed Income#
Investors evaluating physical versus swap-backed funds (see next spoke: synthetic unfunded vs funded swap UCITS ETFs) across Fidelity, Charles Schwab, and Interactive Brokers can verify exact replication disclosures in Form N-PORT and UCITS KIID documents:
| Benchmark Cohort | Replication Method | Typical Holdings Count | Annual Tracking Difference | Key Due-Diligence Check |
|---|---|---|---|---|
| Intermediate U.S. Treasury (IEF 7-10Y) | Full Physical Replication | 14 - 20 Treasury Notes | Equals -ER (-3 to -15 bps) | Compare headline ER in ETF expense calculator |
| Core Aggregate Bond (GOVT-AGG-BND) | Stratified Cell + TBA MBS | 6,000 - 11,500 CUSIPs | -1.5 to -4.0 bps | Verify MBS TBA % on SEC Form N-PORT |
| IG Corporate Credit (LQD-VCIT) | Stratified Multi-Factor | 1,200 - 2,800 CUSIPs | -1.0 to -4.5 bps | Check max single-issuer weight deviation (<20 bps) |
| European Sovereign / Corp UCITS (ESMA) | Sampled Physical or Swap | 350 - 1,400 ISINs | -4.0 to -12.0 bps | Confirm FCA / CBI securities-lending split |
Allocator Takeaway on Small-AUM Bond ETFs#
Do not penalize a $150 million AUM investment-grade ETF for holding 480 bonds instead of 3,200. Holding 480 institutional $300,000 round lots across all 144 duration/sector/rating cells achieves far tighter real-world liquidity and lower rebalance slippage than slicing $150 million into 3,200 untradable $45,000 odd lots.
Frequently asked questions
When does an ETF prospectus permit stratified sampling instead of full replication?
Form N-1A principal investment strategies typically commit an index ETF to invest at least 80% of assets in component securities while explicitly authorizing representative sampling whenever full replication is impractical or increases transaction drag.
How many bonds are needed to track a 3,500-bond corporate index within 5 bps tracking error?
Empirical fixed income factor models demonstrate diminishing diversification gains beyond 450 to 700 well-distributed corporate bonds, provided issuer concentration caps prevent single-name downgrade shocks and key-rate durations match to +/-0.03 years.
Does stratified sampling introduce active management risk into passive bond ETFs?
Only tightly bounded residual risk. Unlike active managers making directional duration or credit bets, a sampling optimizer minimizes ex-ante tracking error subject to strict zero-beta constraints across Treasury curve twists and sector spread widening.
Why do larger bond ETFs hold a higher percentage of index CUSIPs than smaller ETFs?
As an Aggregate or IG bond ETF scales from $200M to $50B+ AUM, years of diverse Rule 6c-11 custom creation baskets naturally accumulate 4,000 to 10,000 seasoned CUSIPs at institutional round-lot sizes without paying secondary odd-lot markups.
Publication record
- Published
- November 14, 2026
- Updated
- November 14, 2026
- Author
- Claire Devon, CFA, CIPM
- Review
- Review not recorded
- Automated fact check
- Passed in the stored pipeline record
- Source URLs
- 4 recorded
AI assistance recorded: anthropic/claude-opus-4.6. This field does not establish human review or source verification.
Academic & Institutional Attribution
Cite This Research & Embed Live Data Card
Standard academic & institutional research paper citation format.
Claire Devon, CFA, CIPM. (2026, November 14). Physical Full Replication vs Stratified Sampling in Bond ETFs: Cell-Matching Optimization. ETFYield Lab. https://etfyieldlab.com/yield-guides/physical-full-replication-vs-stratified-sampling-bond-etfsRelated ETF Creation Redemption Tracking & Institutional Briefings
Explore ETF Creation Redemption Tracking Hub (20) →ETF Creation Redemption Tracking
SEC Rule 6c-11 Authorized Participant Baskets, NAV Premium/Discount & ETF Tracking Difference GuideETF Creation Redemption Tracking
Synthetic Unfunded vs Funded Total Return Swap UCITS ETFs: ESMA Counterparty Limits & Reset MathETF Creation Redemption Tracking
Closing Auction Imbalance, MOC Orders & Intraday ETF Execution Spreads: Timing MicrostructureETF Creation Redemption Tracking
Fractional ETF Share Omnibus Internalization, FINRA TRF Reporting & SIPC Custody ClaimsETF Creation Redemption Tracking
Institutional RFQ Block Desk Execution vs VWAP Algo Routing for Fixed-Income ETFsETF Creation Redemption Tracking
TIPS CPI-U Index Ratio Accrual Lag & Month-End ETF NAV Rebalance Drift (SCHP, TIP, VTIP)ETF Creation Redemption Tracking
UCITS Currency-Hedged Share Class NAV Mechanics: 1-Month WM Forward Roll Carry & CIP BasisETF Creation Redemption Tracking
ETF Closure, Board Liquidation & Delisting Audit: Avoiding NAV Wind-Down & Tax TrapsSEC Yield Distribution Tax Drag
TIPS Original Issue Discount (OID) Phantom Tax vs Monthly TIPS ETF Cash DistributionsSEC Yield Distribution Tax Drag
Ex-Dividend Date NAV Drop & The 61-Day QDI Holding-Period Trap: Why Dividend Capture FailsSEC Yield Distribution Tax Drag
IRC Section 1091 Wash-Sale Rules & "Substantially Identical" Bond ETF Tax-Loss Harvesting SwapsSEC Yield Distribution Tax Drag
Contractual vs Voluntary ETF Expense Ratio Fee Waivers: Auditing Subsidized SEC Yield Cliffs
ETFYield Lab Data, Benchmarks & Contributor Records
CC BY 4.0 Open Data
Open Institutional Datasets (CSV / JSON) →
Download desk-compiled quantitative series & schemas.
2026 Reference Matrix
2026 Institutional Benchmarks & Thresholds →
Statutory capital, clearing, margin & rate conventions.
Editorial Records
Authors & Review Records →
View named contributors where those records are available.
Complete Index
Master Research & Dossier Archive →
Browse all published briefings by topic pillar & date.