
Covered Call Buffer Option Etfs
100% Downside-Protection "Max Buffer" ETFs vs DIY T-Bill + S&P 500 Call Barbell: Fee & Tax Comparison
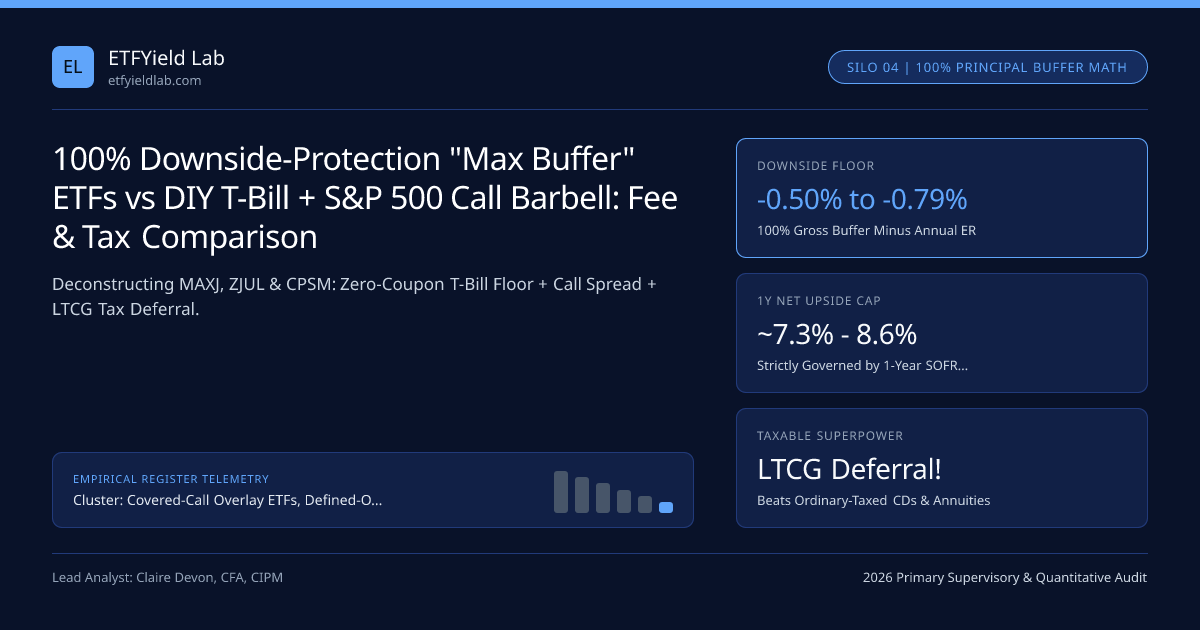
100% Downside-Protection ETFs promise 0% S&P 500 downside before fees with a ~7.5% to 9.0% 1-year upside cap; yet option-replication math proves they simply spend your ~4.4% risk-free T-Bill interest on an ATM call spread while charging 0.50% to 0.79% in annual fees!
Wall Street marketers call them "Equity Upside With 100% Downside Protection" (MAXJ, MAXI, TJUL, ZJAN, CPSM)—a pitch that pulled billions out of bank CDs and fixed indexed annuities. Strip away the marketing mystique via Put-Call Parity, however, and every 100% Principal-Buffer ETF reduces to an extraordinarily simple two-piece machine: 95.8% Zero-Coupon 1-Year Risk-Free Bill + 4.2% S&P 500 Bull Call Spread! Once you see that exact equation, you know instantly when 100% Buffer ETFs are brilliant tax tools—and when they become overpriced traps!
Inside our Covered-Call & Buffer ETF Hub and Option-Overlay Master Guide, pair this principal-protection audit with how SOFR rates price buffer caps and bank structured notes vs OCC buffer ETFs.
Inside the "Zero-Loss" Box: Spending T-Bill Interest on an SPX Call Spread#
Why didn't 100% Protection ETFs exist during the 0% interest-rate era of 2010–2021? Trace the $100.00 present-value option budget at 4.40% SOFR versus 1.50% SOFR:
Exact Mathematical Comparison: MAXJ vs DIY Bill + XSP Call vs BOXX + VOO#
Let us test $100,000 across three capital-preservation architectures in a Top-Bracket Taxable Account (40.8% Ordinary, 23.8% LTCG) when 1-year T-Bills yield 4.40%:
- Architecture A — 1-Year Bank CD @ 4.40% (40.8% Fed + 9.3% State Tax = 50.1% Tax):
- Guaranteed Pre-Tax = +4.40% | Guaranteed After-Tax = +2.20% ($2,200) regardless of SPX!
- Architecture B — iShares 100% Buffer ETF (MAXJ @ 0.50% ER, Gross Cap = +8.50%, Net Cap = +8.00%):
- If SPX <= 0%: Pre-Tax = -0.50% (Harvestable Capital Loss!)
- If SPX >= +8.5%: Pre-Tax = +8.00% | Deferred 0% Tax if Held; or 23.8% LTCG if Sold (>1Yr) = +6.10% After-Tax!
- Expected Value (Assuming 65% prob SPX > +4.5%): Beats Bank CD After-Tax by +190 bps/yr!
- Architecture C — DIY Barbell: 82% SGOV/BOXX (0.14% avg ER) + 18% Uncapped VOO (0.03% ER -> 0.12% Blended Fee):
- Worst Bear (-25% SPX): 0.82(+4.3%) + 0.18(-23.6%) = -0.72% (Nearly IDENTICAL -0.50% Floor!)
- Strong Bull (+25% SPX): 0.82(+4.3%) + 0.18(+26.4%) = +8.28% UNCAPPED (And +10.9% if SPX +40%!)
Look at Architecture C (82% SGOV/BOXX + 18% VOO)—at one-fourth the fee (0.12% vs 0.50%–0.79%), it nearly matches a 100% Buffer ETF in a -25% crash while capturing uncapped +30% bull years! Run your own fee comparisons in our ETF expense ratio calculator.
Comparing Capital-Preservation Vehicles Across Tax & Rate Regimes#
Tactical Deployment Matrix Across Custodians#
| Conservative Mandate | Optimal Implementation | Net Fee | Execution & Custody Rail |
|---|---|---|---|
| Replacing a Fixed Indexed Annuity or Market-Linked CD | iShares 100% Hedge (MAXJ / MAXI) (At Day-1 Reset!) | 0.50% | Daily liquid + LTCG deferral at Fidelity / Schwab (SIPC) |
| Multi-Year Conservative Compounding (All Rate Regimes) | 80% SGOV / BOXX + 20% VOO | 0.08% - 0.16% | Compare after-tax yield in T-Bill/Duration Tax Tool |
| Exact 1-Year Known Cash Liability (Zero -0.5% Loss Tolerance) | 100% Pure SGOV or Direct 52-Week U.S. T-Bill | 0.00% - 0.09% | Guaranteed +4.4% even if SPX drops -20% at IBKR (SEC) |
Legacy 0.79%–0.85% Max Buffer ETFs | Swap at Reset Into 0.50% MAXJ Suite | Saves 29–35 bps | Adds +0.30%/yr directly to your net cap! |
Institutional Verdict on 100% Buffer ETFs#
Use 0.50% 100% Buffer ETFs (MAXJ) strictly as liquid, LTCG-deferred replacements for high-commission insurance Fixed Indexed Annuities while SOFR exceeds 3.50%—and switch immediately to a low-fee SGOV + VOO barbell if Fed rate cuts compress 100%-buffer caps below 6%!
Frequently asked questions
Can a "100% Downside Protection" Buffer ETF still lose money over 12 months?
By its annual expense ratio, YES! A "100% Buffer" protects 100% of gross reference index losses BEFORE fund expenses—so if the S&P 500 drops -30% over the 1-year outcome period, a 0.79%-ER 100% Buffer ETF returns approximately -0.79% (or -0.50% on a 0.50%-ER iShares MAXJ share held Day 1 to Day 365).
What happens to 100% Buffer ETF upside caps if the Federal Reserve cuts interest rates back to 2.0%?
Their upside caps collapse! Because 100% Buffer ETFs use the risk-free SOFR interest rate to pay for equity upside, cutting SOFR from 4.50% down to 2.00% slashes 1-year gross upside caps from ~8.5% down to ~3.8%-4.5% (barely ~3.2% net after a 0.79% fee!).
How do 100% Buffer ETFs beat Bank Market-Linked CDs and Fixed Indexed Annuities (FIAs)?
Decisively on liquidity, tax, and fees! Annuities and Market-Linked CDs lock your money up for 3 to 7 years with 7%-10% surrender penalties and tax CD/annuity gains as ordinary income—whereas MAXJ/ZJUL trade daily at 2-bp spreads with 0% surrender fees and 15%-23.8% LTCG deferral!
How does a DIY 80% SGOV + 20% VOO portfolio compare against a 100% Buffer ETF?
In a catastrophic -30% S&P 500 crash, 80% SGOV (+4.4%) + 20% VOO (-28.6%) dips -2.2% vs -0.5% on MAXJ—pretty close! Yet in a +28% bull year, 80/20 earns +9.1% UNCAPPED at a 0.08% fee, beating a capped 0.79% Buffer ETF across most multi-year horizons!
Publication record
- Published
- November 13, 2026
- Updated
- November 14, 2026
- Author
- Claire Devon, CFA, CIPM
- Review
- Review not recorded
- Automated fact check
- Passed in the stored pipeline record
- Source URLs
- 4 recorded
AI assistance recorded: anthropic/claude-opus-4.6. This field does not establish human review or source verification.
Academic & Institutional Attribution
Cite This Research & Embed Live Data Card
Standard academic & institutional research paper citation format.
Claire Devon, CFA, CIPM. (2026, November 14). 100% Downside-Protection "Max Buffer" ETFs vs DIY T-Bill + S&P 500 Call Barbell: Fee & Tax Comparison. ETFYield Lab. https://etfyieldlab.com/yield-guides/100-downside-hedge-max-buffer-etfs-vs-tbill-plus-call-diyRelated Covered Call Buffer Option Etfs & Institutional Briefings
Explore Covered Call Buffer Option Etfs Hub (20) →Covered Call Buffer Option Etfs
Covered-Call Overlay ETFs, Defined-Outcome Buffer Caps & Upside Capture Master GuideCovered Call Buffer Option Etfs
Protective Collar & Tail-Risk ETFs (NUSI, SPD & TAIL): Why 25-Delta Put Skew Bleeds CompoundingCovered Call Buffer Option Etfs
Bank Autocallable Structured Notes vs OCC-Cleared Buffer ETFs: Credit Risk, Hidden Fees & LiquidityCovered Call Buffer Option Etfs
Gold & Commodity Covered-Call ETFs (GLDI, IAUI & SLVO): Positive Call Skew, ETN Risk & Inflation CapsCovered Call Buffer Option Etfs
Retirement Sequence-of-Returns Risk With Covered-Call ETFs: Why 8% Spend-Down Depletes Capped PortfoliosCovered Call Buffer Option Etfs
How SOFR Interest Rates & Volatility Skew Price Buffer ETF Upside Caps: Black-Scholes Budget MathCovered Call Buffer Option Etfs
The Hidden Dividend Forfeiture Inside Buffer ETFs: Price-Return Index Reference vs Total-Return S&P 500Covered Call Buffer Option Etfs
IRC Section 1092 Tax Straddles & Qualified Covered Calls (QCC) in Option ETFs: Holding-Period & QDI TrapsDividend Growth Credit Income Etfs
Total Shareholder Yield ETFs (SYLD & DIVB): Combining Cash Dividends, Net Buybacks & Debt PaydownDividend Growth Credit Income Etfs
International Developed Dividend ETFs (SCHY, VYMI & IDV): FCF Screens, Foreign Tax Credits & FXDividend Growth Credit Income Etfs
Taxable vs Roth/Traditional IRA DRIP Compounding Math: Tax-Lot Hygiene & Yield-on-Cost MythsDividend Growth Credit Income Etfs
Investment-Grade Corporate Bond ETFs (LQD, VCIT & VCSH): BBB Cliff Risk, OAS & Duration Drift
ETFYield Lab Data, Benchmarks & Contributor Records
CC BY 4.0 Open Data
Open Institutional Datasets (CSV / JSON) →
Download desk-compiled quantitative series & schemas.
2026 Reference Matrix
2026 Institutional Benchmarks & Thresholds →
Statutory capital, clearing, margin & rate conventions.
Editorial Records
Authors & Review Records →
View named contributors where those records are available.
Complete Index
Master Research & Dossier Archive →
Browse all published briefings by topic pillar & date.