
Covered Call Buffer Option Etfs
The Hidden Dividend Forfeiture Inside Buffer ETFs: Price-Return Index Reference vs Total-Return S&P 500
Every Defined-Outcome Buffer ETF fact sheet prominently displays its 0.50% to 0.85% expense ratio while burying a second structural cost in fine-print footnotes: Cboe FLEX options track the Price-Return S&P 500, lifting true total lag in moderate up-markets to ~1.85%–2.20% per year!
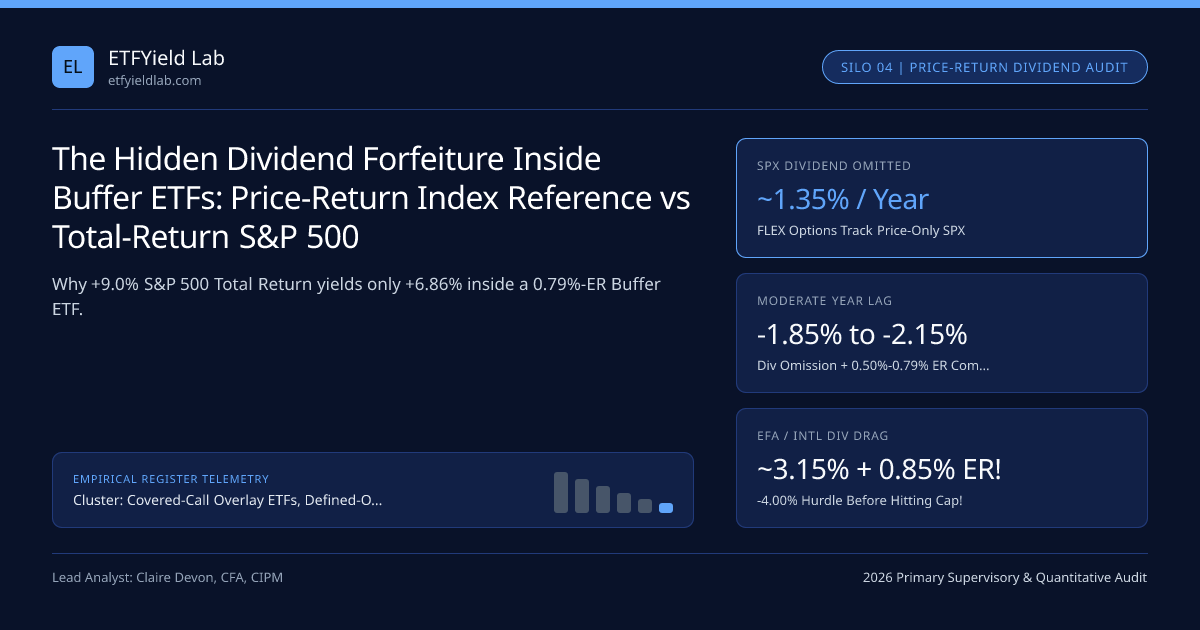
Read the glossy brochure of almost any Defined-Outcome Buffer ETF, and the headline promise sounds crystal clear: "100% 1-for-1 upside participation with the S&P 500 up to a +14.5% Cap, with a 15% downside buffer, for a 0.79% fee." Then an attentive client audits their year-end statement after a calm year in which VOO gained +9.20% (nowhere near the +14.5% cap!)—and discovers their Buffer ETF gained only +7.05%, lagging VOO by -215 basis points! Where did the missing 136 bps vanish? Into the distinction between Price-Return Index (SPX) and Total-Return Index (SPTR)!
Inside our Covered-Call & Buffer ETF Hub and Option-Overlay Master Guide, read this essential accounting audit alongside our 4-leg Cboe FLEX blueprint and Black-Scholes SOFR cap-pricing guide.
Tracing the 1.35% Dividend: Not Stolen, Yet Missing in Moderate Up-Years!#
Let us be 100% mathematically rigorous so you neither fall for retail brochure illusions NOR falsely accuse ETF sponsors of pocketing dividends:
Look at Metric #1 versus Metric #4—an institutional gem almost nobody talks about! Because Nasdaq-100 (QQQ) pays a tiny ~0.60% dividend yield (companies buy back shares instead, which IS captured in Price Return!), a Nasdaq-100 Buffer ETF forfeits only 0.60% of dividends while enjoying higher volatility caps—whereas an MSCI EAFE (EFA) International Buffer ETF forfeits a massive 3.15% dividend plus 0.85% ER (-4.00%/yr drag in moderate years)!
Exact Total-Return Hurdle Equation: Buffer ETF vs Uncapped VOO#
Across every outcome below the cap ($0 le R{ ext{Price}} < C{ ext{gross}}$), compare Uncapped VOO (0.03% ER) against a Buffer ETF on True Total Return:
- RVOOTotal = RSPXPrice + DivYieldSPX - 0.03%
- RBufferTotal = RSPXPrice + 0.00% - ER_Buffer
- Moderate-Market Annual Total-Return Lag = -(DivYieldSPX + ER_Buffer - 0.03%)
- Worked Index-by-Index Moderate-Year Audit (Suppose Each Index Delivers +8.00% Total Return):
- 1. Nasdaq-100 Buffer (0.60% Div, 0.69% ER):
- QQQ Total = +8.00% (+7.40% Price) | Buffer Net = +6.71% -> Lag = -1.29%
- 2. Low-Fee S&P 500 Buffer (iShares IVVM: 1.35% Div, 0.50% ER):
- VOO Total = +8.00% (+6.65% Price) | Buffer Net = +6.15% -> Lag = -1.85%
- 3. Legacy S&P 500 Buffer (1.35% Div, 0.79% ER):
- VOO Total = +8.00% (+6.65% Price) | Buffer Net = +5.86% -> Lag = -2.14%
- 4. International EAFE Buffer (3.15% Div, 0.85% ER):
- IEFA Total = +8.00% (+4.85% Price)| Buffer Net = +4.00% -> Lag = -4.00% (LOSES HALF THE GAIN!)
Model 10-year compounding differences across 0.03% VOO, 0.50% IVVM, and 0.85% international buffers in our ETF expense ratio calculator and Dividend reinvestment calculator.
Comparing Index Suitability for Defined-Outcome Buffers#
Index-Specific Buffer vs Barbell Matrix Across Custodians#
| Underlying Equity Universe | Dividend Yield | Verdict: Buffer ETF vs Uncapped Barbell | Custody & Tool Rail |
|---|---|---|---|
Nasdaq-100 Growth (QQQ) | ~0.60% (Buyback-heavy) | Strong Fit for Buffers (~17%–20% caps, minimal div loss!) | Limit order at Fidelity / Schwab (SIPC) |
U.S. Large-Cap S&P 500 (SPX) | ~1.35% | Good Fit at <=0.50% ER (FBUF / IVVM) for 3–5Y bridges | Check live cap at Interactive Brokers |
International Developed (EFA) | ~3.15% | REJECT Buffer! -> Hold 65% IEFA (0.07%) + 35% SGOV | Captures Foreign Tax Credit + saves 392 bps hurdle! |
| High-Dividend / Value Equity | ~3.40%+ | REJECT Buffer! -> Hold SCHD + BOXX / SGOV | Compare after-tax yield in T-Bill/Duration Tool (SEC) |
Institutional Rule of Thumb#
Always mentally add the reference index’s dividend yield to the Buffer ETF’s expense ratio before evaluating its cap: on Nasdaq-100 and 0.50%-ER S&P 500 buffers, the math works cleanly; on high-dividend European/EAFE indices (3.15% div + 0.85% ER = 4.00% hurdle), build an uncapped IEFA + SGOV barbell instead!
Frequently asked questions
Does the ETF issuer pocket the 1.35% S&P 500 dividend inside a Buffer ETF?
NO—to be 100% fair to ETF issuers, the sponsor only collects its stated 0.50%-0.85% expense ratio! Because the ETF holds a synthetic European FLEX Call (not physical stocks), Black-Scholes prices that call cheaper by the present value of expected S&P 500 dividends (~$1.35 per $100), and that $1.35 discount is automatically used to fund a slightly higher upside cap!
If the foregone dividend goes into funding the option package, why do institutional analysts still call it a "Hidden Lag"?
Because investors read "+15% Buffer / +14.5% Cap" and assume that if the S&P 500 returns +9% total return (well below the +14.5% cap!), they will capture all +9% minus the 0.79% fee! In reality, +9.0% S&P 500 Total Return = +7.65% Price Return + 1.35% Dividend—so the Buffer ETF only earns +7.65% - 0.79% = +6.86% (-214 bps behind VOO)!
Why is an International Developed (EFA) or Emerging Markets (EEM) Buffer ETF penalized much harder on moderate gains?
Because MSCI EAFE (EFA) pays ~3.15% in annual dividends! If EFA Total Return is +8.0% (+4.85% Price + 3.15% Div), an EFA Buffer ETF charging 0.85% ER only captures +4.85% - 0.85% = +4.00%—forfeiting HALF of a moderate +8% international year!
Is there a tax silver lining to omitting the 1.35% S&P 500 dividend in high-bracket taxable accounts?
Partially yes! In a top 23.8% QDI federal + 13.3% California (37.1% combined!) taxable account, receiving VOO’s 1.35% cash dividend costs -0.50%/yr in immediate dividend taxes—whereas recycling that $1.35 pre-tax inside a Buffer ETF’s option budget converts it into tax-deferred LTCG!
Publication record
- Published
- November 13, 2026
- Updated
- November 14, 2026
- Author
- Claire Devon, CFA, CIPM
- Review
- Review not recorded
- Automated fact check
- Passed in the stored pipeline record
- Source URLs
- 3 recorded
AI assistance recorded: anthropic/claude-opus-4.6. This field does not establish human review or source verification.
Academic & Institutional Attribution
Cite This Research & Embed Live Data Card
Standard academic & institutional research paper citation format.
Claire Devon, CFA, CIPM. (2026, November 14). The Hidden Dividend Forfeiture Inside Buffer ETFs: Price-Return Index Reference vs Total-Return S&P 500. ETFYield Lab. https://etfyieldlab.com/yield-guides/price-return-index-dividend-forfeiture-inside-buffer-etfsRelated Covered Call Buffer Option Etfs & Institutional Briefings
Explore Covered Call Buffer Option Etfs Hub (20) →Covered Call Buffer Option Etfs
Covered-Call Overlay ETFs, Defined-Outcome Buffer Caps & Upside Capture Master GuideCovered Call Buffer Option Etfs
IRC Section 1092 Tax Straddles & Qualified Covered Calls (QCC) in Option ETFs: Holding-Period & QDI TrapsCovered Call Buffer Option Etfs
100% ATM Monthly Covered-Call ETFs (XYLD & QYLD): Upside Truncation & Secular NAV Decay MathCovered Call Buffer Option Etfs
OTM Dynamic Overwrite ETFs (JEPI, JEPQ & GPIX): Equity-Linked Notes (ELNs) vs Direct Index OptionsCovered Call Buffer Option Etfs
0DTE Daily Index Covered-Call ETFs (XDTE & QDTE): Intraday Short Gamma vs Uncapped Overnight DriftCovered Call Buffer Option Etfs
Cboe FLEX 4-Leg Defined-Outcome Buffer ETFs (10% & 15% Buffers): Option Payoff & Pricing ArchitectureCovered Call Buffer Option Etfs
Entering Defined-Outcome Buffer ETFs Mid-Period: Remaining Cap Compression & Unbuffered Zone MathCovered Call Buffer Option Etfs
Treasury & Corporate Bond Covered-Call ETFs (TLTW, LQDW & HYGW): Harvesting MOVE Rate Volatility SkewDividend Growth Credit Income Etfs
ETFs of Closed-End Funds (PCEF & YYY): Leverage Borrowing Cost, Double Fees & Discount WideningEarnings Reports
Vitru Q3 2026 slides: record cash flow enables first dividend policyDividend Announcements
Jacobs Engineering declares $0.36 dividendBroker Fees and Calculators
The Czech National Bank’s first DLT bond and the new physics of the digital koruna
ETFYield Lab Data, Benchmarks & Contributor Records
CC BY 4.0 Open Data
Open Institutional Datasets (CSV / JSON) →
Download desk-compiled quantitative series & schemas.
2026 Reference Matrix
2026 Institutional Benchmarks & Thresholds →
Statutory capital, clearing, margin & rate conventions.
Editorial Records
Authors & Review Records →
View named contributors where those records are available.
Complete Index
Master Research & Dossier Archive →
Browse all published briefings by topic pillar & date.