
ETF Creation Redemption Tracking
ETF Tracking Difference vs Tracking Error: Institutional Return Attribution & Fee Offset Math
Tracking difference measures cumulative net return drift relative to an index (-18 bps to +4 bps annually), whereas tracking error measures the standard deviation of active return volatility.
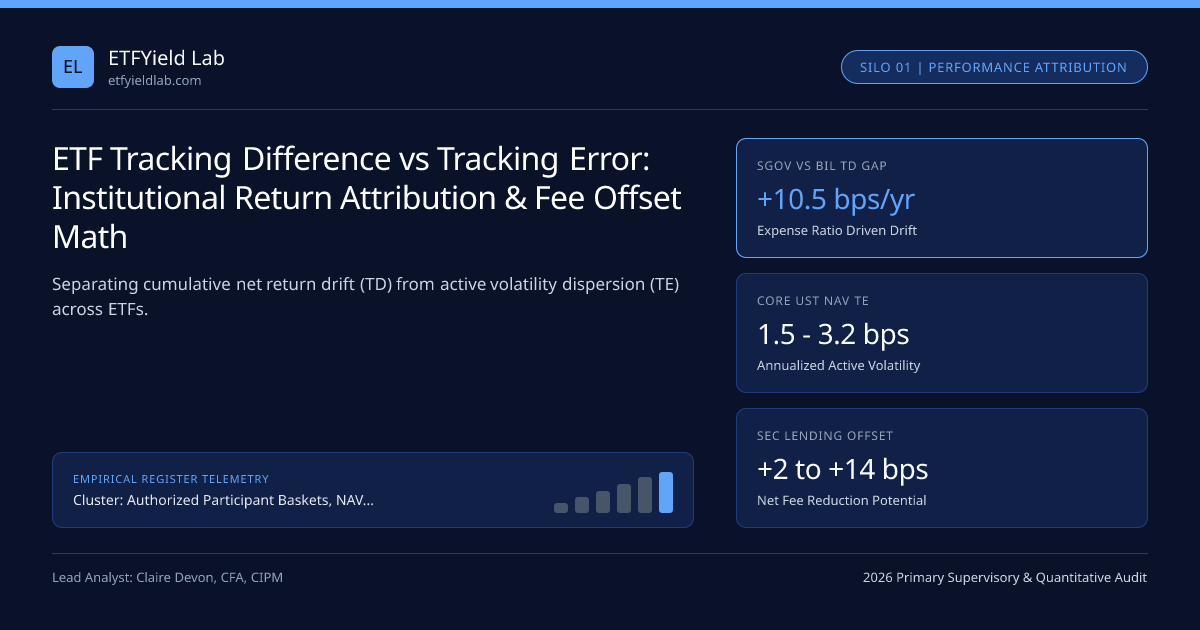
Institutional Request-for-Proposal (RFP) questionnaires routinely conflate two mathematically distinct metrics: Tracking Difference (TD) and Tracking Error (TE). A retail cash sweep ETF charging 0.40% to replicate 3-month Treasury bills will deliver an exemplary 0.02% annualized tracking error—its daily return curve hugs the index parallel to the fourth decimal place—while inflicting a -0.40% annual tracking difference that erodes $40,000 per $10 million every single year. Conversely, a sampled corporate bond ETF may register 0.22% price-based tracking error due to intraday OTC mark timing yet finish the year within -0.03% of its gross benchmark.
Within our Authorized Participant & Tracking Hub and SEC Rule 6c-11 AP Custom Baskets Guide, mastering five-factor return attribution allows portfolio strategists to look past headline marketing fees and model true realized net yield.
Five-Factor Mathematical Decomposition of TD and TE#
Under both ESMA UCITS ETF guidelines (ESMA/2014/937) and CFA Institute CIPM performance attribution standards, periodic active return $dt = r{ ext{ETF},t} - r_{ ext{Index},t}$ separates cleanly into systematic drift and stochastic dispersion:
- TD = Prod{t=1..T}(1 + rETF,t) - Prod{t=1..T}(1 + rIndex,t)
- ~= -ERnet + RSecLend + (WHTIndex - WHTFund) - DragCashRebal + Alpha_Basket
- 2. Annualized Ex-Post Tracking Error (Active Volatility):
- TE = sqrt(M) * sqrt( [1 / (T - 1)] * Sum{t=1..T} (dt - d_bar)^2 )
- (where M = 252 for daily observations or M = 12 for monthly NAV returns)
- Worked 10-Year $1,000,000 T-Bill ETF Comparison (4.25% Gross Index Yield):
- ETF A (SGOV-0-3M-UST Benchmark, ~3 bps net drag): TD = -0.03%/yr -> Terminal Value = $1,511,890
- ETF B (BIL-1-3M-TBILL Benchmark, 13.56 bps ER) : TD = -0.14%/yr -> Terminal Value = $1,495,350
- Compounded Tracking Difference Gap : $16,540 despite virtually identical 2.1 bps TE!
Readers can verify that exact $16,540 terminal compounding gap in seconds using our interactive ETF expense ratio calculator, comparing iShares 0-3 Month Treasury Bond ETF (SGOV) against SPDR Bloomberg 1-3 Month T-Bill ETF (BIL).
Why NAV-Based TE Differs from Market-Price TE#
When screening fixed income ETFs such as Core Aggregate Bond ETFs (GOVT, BND, AGG) or Full-Curve TIPS ETFs (SCHP vs TIP), always compute tracking error on official NAV returns separately from 16:00 ET secondary market price returns:
- NAV-vs-Index TE isolates pure portfolio management skill: stratified sampling accuracy (analyzed in physical full replication vs stratified sampling in bond ETFs), cash equitization via Treasury futures, and CPI accrual alignment (see TIPS CPI index ratio lag).
- Price-vs-Index TE adds secondary microstructure volatility: closing auction order imbalances, time-zone staleness, and evaluated bond pricing lags. Because closing premiums mean-revert within 1 to 3 trading days, elevated Price-vs-Index TE overstates true long-term holding risk.
Asset-Class Attribution: Realized TD vs NAV Tracking Error#
Benchmark Comparison Across Core ETF Cohorts & Custodians#
Allocators executing across Fidelity, Charles Schwab, and Interactive Brokers can benchmark expected TD and TE tolerances across major yield sleeves:
| Asset Cohort & Benchmark Standard | Representative ER Range | Expected Annual TD vs Gross Index | Expected Monthly NAV TE (Ann.) | Primary TD Offset Lever |
|---|---|---|---|---|
| Ultrashort 0-3M T-Bills (SGOV) | 0.03% - 0.14% | -3.0 to -14.0 bps | 1.0 - 2.5 bps | Fee waiver audit; model in T-Bill tax comparator |
| Full-Curve U.S. TIPS (SCHP vs TIP) | 0.03% - 0.19% | -3.2 to -18.5 bps | 3.5 - 6.0 bps | Low headline ER; check duration in Bond duration tool |
| U.S. Core Aggregate (GOVT-AGG-BND) | 0.03% - 0.05% | -1.5 to -4.5 bps | 4.5 - 8.5 bps | TBA dollar-roll optimization & custom basket sampling |
| Irish Physical UCITS (ESMA / FCA) | 0.05% - 0.12% | +10 to +18 bps (vs 30% Net Index) | 2.5 - 5.0 bps | US-Ireland 15% dividend treaty withholding advantage |
Institutional Selection Protocol#
Never rank competing ETFs solely by sorting headline expense ratios from lowest to highest. Pull three-year rolling total-return series from Form N-CSR and compare TD - (-ER): any ETF consistently lagging its own expense ratio by more than 6 bps per year suffers from sloppy index-rebalance execution, uninvested cash drag, or unfavorable securities-lending splits.
Frequently asked questions
Which matters more for a 10-year buy-and-hold bond ladder: tracking difference or tracking error?
Tracking difference dominates multi-year wealth accumulation because systematic annual drag compounds geometrically every year. Tracking error primarily matters for short-horizon hedge desks, leveraged pair trades, or institutional mandates subject to strict active-risk limits.
How can an ETF post a positive tracking difference that beats its benchmark index?
Three mechanisms enable positive net tracking difference: securities lending revenue exceeding the headline expense ratio, favorable Irish UCITS 15% dividend tax treaty rates compared to an index assuming 30% withholding, and fixed income new-issue concession capture.
Why does apparent daily tracking error spike in corporate bond ETFs during volatile weeks?
Benchmark bond indices value constituents using 15:00 or 16:00 ET evaluated matrix prices, whereas ETF market prices incorporate live late-afternoon macro trades. Computing tracking error on NAV-vs-Index rather than Price-vs-Index eliminates up to 75% of artificial volatility.
How does uninvested dividend cash drag affect tracking difference?
Total-return indices assume dividends are reinvested instantaneously on the ex-dividend date. If an ETF holds uninvested dividend receivables in non-interest-bearing cash for several days before payout or reinvestment, upward-trending markets create 1 to 4 bps of annual cash drag.
Publication record
- Published
- November 14, 2026
- Updated
- November 14, 2026
- Author
- Claire Devon, CFA, CIPM
- Review
- Review not recorded
- Automated fact check
- Passed in the stored pipeline record
- Source URLs
- 4 recorded
AI assistance recorded: anthropic/claude-opus-4.6. This field does not establish human review or source verification.
Academic & Institutional Attribution
Cite This Research & Embed Live Data Card
Standard academic & institutional research paper citation format.
Claire Devon, CFA, CIPM. (2026, November 14). ETF Tracking Difference vs Tracking Error: Institutional Return Attribution & Fee Offset Math. ETFYield Lab. https://etfyieldlab.com/yield-guides/tracking-difference-vs-tracking-error-etf-decompositionRelated ETF Creation Redemption Tracking & Institutional Briefings
Explore ETF Creation Redemption Tracking Hub (20) →ETF Creation Redemption Tracking
SEC Rule 6c-11 Authorized Participant Baskets, NAV Premium/Discount & ETF Tracking Difference GuideETF Creation Redemption Tracking
Three-Layer ETF Liquidity Waterfall: Lit Order Books, Dealer RFQ Inventory & AP Creation UnitsETF Creation Redemption Tracking
High-Yield Bond ETF NAV Discounts During Credit Stress: Live Price Discovery vs Stale Matrix MarksETF Creation Redemption Tracking
Municipal Bond ETF Odd-Lot Evaluated Pricing & MSRB EMMA NAV Spreads: Tax-Exempt ArbitrageETF Creation Redemption Tracking
DTCC/NSCC T+1 Settlement & ETF Authorized Participant Collateral Funding CostsETF Creation Redemption Tracking
Agency MBS ETF TBA Roll Settlement, Specified Pools & Basket Slippage Math (MBB vs VMBS)ETF Creation Redemption Tracking
Authorized Participant Balance Sheet & Basel III SLR Constraints: Quarter-End ETF Discount SpikesETF Creation Redemption Tracking
Physical Full Replication vs Stratified Sampling in Bond ETFs: Cell-Matching OptimizationSEC Yield Distribution Tax Drag
Irish-Domiciled UCITS ETFs: 15% vs 30% U.S. Dividend Treaty Withholding & Estate Tax ShieldSEC Yield Distribution Tax Drag
Non-Resident Alien (NRA) 30% ETF Withholding & IRC Section 871(k) Qualified Interest RefundsSEC Yield Distribution Tax Drag
State-Tax Exemption & U.S. Government Obligation Thresholds in SGOV, USFR, BIL & IEF (CA, NY, CT)SEC Yield Distribution Tax Drag
Municipal Bond ETF Tax-Equivalent Yield, 3.8% NIIT Exemption & AMT Private Activity Bond Math
ETFYield Lab Data, Benchmarks & Contributor Records
CC BY 4.0 Open Data
Open Institutional Datasets (CSV / JSON) →
Download desk-compiled quantitative series & schemas.
2026 Reference Matrix
2026 Institutional Benchmarks & Thresholds →
Statutory capital, clearing, margin & rate conventions.
Editorial Records
Authors & Review Records →
View named contributors where those records are available.
Complete Index
Master Research & Dossier Archive →
Browse all published briefings by topic pillar & date.