
Treasury Bill Bond Ladder Etfs
Zero-Coupon Treasury STRIPS ETFs (EDV & ZROZ) vs 20+ Year Coupon TLT: 25-Year Duration & Convexity Math
Because standard 20+ year coupon bonds pay half their present value in intermediate semi-annual coupons, iShares TLT caps duration near 16.2 years: zero-coupon U.S. Treasury STRIPS ETFs (EDV and ZROZ) stretch pure duration to 24.5–27.1 years with +78% higher positive convexity per dollar.
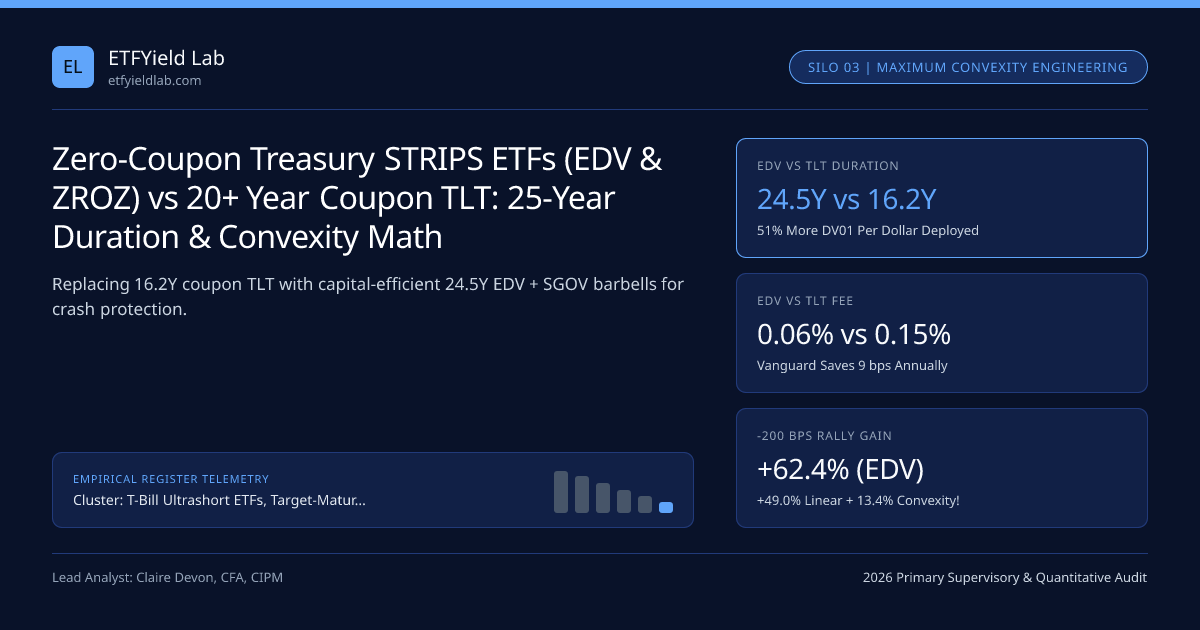
Institutional tail-risk hedging desks rarely buy coupon-paying iShares 20+ Year Treasury Bond ETF (TLT) (2026 Benchmark Standard) when seeking pure equity-crash deflation convexity. Why tie up $100,000 of portfolio capital at a 0.15% ER to get 16.2 years of duration when $66,000 in Vanguard Extended Duration Treasury ETF (EDV, 0.06% ER, 24.5Y U.S. Treasury STRIPS) paired with $34,000 in SGOV delivers the exact same 16.2Y duration, higher quadratic positive convexity, and 47% lower annual fees?
Within our T-Bill & Bond Ladder Hub and T-Bill & Bond Ladder Master Guide, connect this maximum-convexity STRIPS audit with our SGOV + TLT vs IEF barbell comparison, 10-year Redington duration immunization, and verify exact second-order price curves in our Bond yield & duration calculator.
How U.S. Treasury STRIPS Unlock Pure 25-to-27-Year Convexity#
Under the U.S. Treasury’s STRIPS program (Separate Trading of Registered Interest and Principal of Securities), primary dealers strip a 30-year Treasury bond into 60 individual semi-annual coupon zeros plus 1 final Principal STRIP due in Year 30. Because zero cash arrives before maturity, Macaulay Duration equals exact years to maturity (T), and Convexity scales with T^2!
Second-Order Taylor Expansion: 66% EDV + 34% SGOV vs 100% TLT#
Let us prove mathematically why replacing 100% TLT with a Duration-Matched 66% EDV + 34% SGOV Synthetic Barbell dominates in BOTH deflationary crashes (+200 bps rally) AND inflationary rate spikes (-200 bps selloff):
- Portfolio A: 100% TLT -> D_mod = 16.20Y, Convexity C = 335, Fee = 0.15% ER
- Portfolio B: 66.0% EDV (D=24.50Y, C=670, 0.06% ER) + 34.0% SGOV (D=0.08Y, C=0, 0.09% ER)
- > Blended Duration = (0.66 * 24.50) + (0.34 * 0.08) = 16.20 Years (IDENTICAL Linear DV01!)
- > Blended Convexity = (0.66 * 670) + 0 = 442.2 (+32.0% HIGHER Positive Convexity!)
- > Blended Fee = (0.66 * 0.06%) + (0.34 * 0.09%) = 0.070% ER (-53% Fee Reduction!)
- Instantaneous +/- 200 bps Parallel Long-Rate Shock (dP/P = -Ddy + 0.5C*(dy)^2):
- 1. Recessionary Crash (-200 bps: 30Y Yield drops from 4.60% to 2.60%):
- Portfolio A (100% TLT) = +32.40% + (0.5 * 335 * 0.04) = +39.10%
- Portfolio B (66% EDV+34% SGOV)= +32.40% + (0.5 * 442.2 * 0.04) = +41.24% (+214 bps FREE Convexity Win!)
- 2. Inflation Shock (+200 bps: 30Y Yield jumps from 4.60% to 6.60%):
- Portfolio A (100% TLT) = -32.40% + 6.70% = -25.70%
- Portfolio B (66% EDV+34% SGOV)= -32.40% + 8.84% = -23.56% (+214 bps LESS Drawdown!)
Test any rate-shock scenario across IEF, TLT, EDV, and ZROZ in our Bond yield & duration calculator, and verify multi-year fee savings in our ETF expense ratio calculator.
Long-Duration Treasury & STRIPS ETF Comparison#
Tactical Implementation Across Verified Brokerages#
| Portfolio Role | Optimal Long-Treasury Vehicle | Net Fee | Execution & Custody Rail |
|---|---|---|---|
Capital-Efficient Equity Crash Hedge (85% Equity / 15% STRIPS) | Vanguard EDV (24.5Y STRIPS) | 0.06% | Rebalance annually inside IRA at Fidelity / Schwab (SIPC) |
Maximum Pure Convexity Macro Trade (-150 bps recession thesis) | PIMCO ZROZ (27.1Y Principal STRIPS) | 0.15% | Midpoint limit orders at Interactive Brokers |
| Passive 20+ Year Coupon Treasury Buy-and-Hold | SPDR SPTL (0.03%) or Vanguard VGLT (0.04%) | 0.03% - 0.04% | Check state tax advantage in T-Bill/Duration Tax Tool |
| Listed Options / Institutional Liquidity Hedge | Legacy TLT (1-bp option penny pilot) | 0.15% | Regulated under SEC Rule 6c-11 & Cboe options |
Risk Sizing Discipline for 25-Year STRIPS#
Because EDV and ZROZ exhibit equity-like 18% to 24% annualized volatility, size a STRIPS sleeve by DV01 dollars, not portfolio weight: a 10% EDV sleeve inside a 90% S&P 500 growth portfolio contributes 2.45 years of portfolio duration—delivering the defensive punch of a traditional 65/35 balanced fund while keeping 90% of capital compounding in equities!
Frequently asked questions
Why is the duration of TLT only ~16.2 years when it holds 20-to-30-year U.S. Treasury bonds?
Macaulay duration is the present-value-weighted average timing of ALL cash flows! On a 25-year 4.50% coupon bond, more than half of the bond’s present value arrives in years 1 through 24 via semi-annual coupon checks—pulling duration down to ~16.2 years. Zero-coupon STRIPS have 100% of cash flow at year 25-30!
What is the structural difference between Vanguard EDV (0.06% ER) and PIMCO ZROZ (0.15% ER)?
Vanguard EDV tracks the Bloomberg US Treasury STRIPS 20-30 Year Equal Par Bond Index (~24.5Y modified duration, ultra-low 0.06% fee). PIMCO ZROZ tracks the ICE BofA Long US Treasury Principal STRIPS Index concentrated in the 25-30 year bucket (~27.1Y modified duration, highest pure convexity on US exchanges, 0.15% fee).
How can a Zero-Coupon STRIPS ETF pay a 4%+ quarterly dividend if zero-coupon bonds pay zero cash coupons?
Under IRC Original Issue Discount (OID) rules, zero-coupon bonds accrue imputed compound interest daily toward $100 par. To maintain Regulated Investment Company (RIC) pass-through status, EDV and ZROZ distribute that imputed OID yield quarterly in cash (sourced from rolling/trimming appreciated STRIPS).
Why did EDV and ZROZ drop over -55% from 2020 peak to October 2023 trough?
25-to-27-year duration cuts symmetrically on rate spikes! When 30-year Treasury yields surged from 1.20% in August 2020 to 5.10% in October 2023 (+390 bps) from a near-zero starting yield cushion, linear duration alone inflicted massive drawdowns—proving STRIPS belong in sized 10%-15% convexity sleeves, never 100% cash substitutes!
Publication record
- Published
- November 13, 2026
- Updated
- November 15, 2026
- Author
- Claire Devon, CFA, CIPM
- Review
- Review not recorded
- Automated fact check
- Passed in the stored pipeline record
- Source URLs
- 4 recorded
AI assistance recorded: anthropic/claude-opus-4.6. This field does not establish human review or source verification.
Academic & Institutional Attribution
Cite This Research & Embed Live Data Card
Standard academic & institutional research paper citation format.
Claire Devon, CFA, CIPM. (2026, November 15). Zero-Coupon Treasury STRIPS ETFs (EDV & ZROZ) vs 20+ Year Coupon TLT: 25-Year Duration & Convexity Math. ETFYield Lab. https://etfyieldlab.com/yield-guides/zero-coupon-treasury-strips-etfs-edv-zroz-25y-convexityRegulatory Directory Cross-Reference
Referenced Institutions & Regulatory Registries
Mentioned Regulated Institutions
Related Treasury Bill Bond Ladder Etfs & Institutional Briefings
Explore Treasury Bill Bond Ladder Etfs Hub (20) →Treasury Bill Bond Ladder Etfs
T-Bill Ultrashort ETFs, Target-Maturity Bullet Ladders & Roll-Down Yield Engineering GuideTreasury Bill Bond Ladder Etfs
Core Aggregate Bond ETFs (AGG & BND) vs Pure Treasury (GOVT): Agency MBS Convexity & Issuance DriftTreasury Bill Bond Ladder Etfs
Agency CMBS ETFs (CMBS) vs Residential Mortgage-Backed ETFs (MBB & VMBS): Lockout Call Protection & OAS MathTreasury Bill Bond Ladder Etfs
Ultrashort Active Corporate & Commercial Paper ETFs (JPST, MINT & ICSH) vs Pure T-Bill ETFs: SALT Tax AuditTreasury Bill Bond Ladder Etfs
10-Year Bond Ladder Redington Immunization: Matching DV01 Duration, Dispersion & Dated Cash LiabilitiesTreasury Bill Bond Ladder Etfs
Callable Federal Agency Debenture ETFs (FHLB, FNMA & FFCB) vs Bullet Treasuries: Convexity & OAS MathTreasury Bill Bond Ladder Etfs
T-Bill ETF Reg T & Portfolio Margin Haircuts vs Direct Treasury Bills: Collateral & Futures Margin MathTreasury Bill Bond Ladder Etfs
Yield Curve Disinversion & Steepening Playbook: Quantitative Rules for Rotating T-Bills Into 3–7Y LaddersCovered Call Buffer Option Etfs
Protective Collar & Tail-Risk ETFs (NUSI, SPD & TAIL): Why 25-Delta Put Skew Bleeds CompoundingCovered Call Buffer Option Etfs
Bank Autocallable Structured Notes vs OCC-Cleared Buffer ETFs: Credit Risk, Hidden Fees & LiquidityCovered Call Buffer Option Etfs
Gold & Commodity Covered-Call ETFs (GLDI, IAUI & SLVO): Positive Call Skew, ETN Risk & Inflation CapsCovered Call Buffer Option Etfs
Retirement Sequence-of-Returns Risk With Covered-Call ETFs: Why 8% Spend-Down Depletes Capped Portfolios
ETFYield Lab Data, Benchmarks & Contributor Records
CC BY 4.0 Open Data
Open Institutional Datasets (CSV / JSON) →
Download desk-compiled quantitative series & schemas.
2026 Reference Matrix
2026 Institutional Benchmarks & Thresholds →
Statutory capital, clearing, margin & rate conventions.
Editorial Records
Authors & Review Records →
View named contributors where those records are available.
Complete Index
Master Research & Dossier Archive →
Browse all published briefings by topic pillar & date.