
Dividend Growth Credit Income Etfs
High-Dividend Yield-Trap Forensics (SPYD, HDV & VYM): FCF Coverage Failures & Sector Concentration
Why does buying the highest-yielding 80 stocks in the S&P 500 (SPYD) suffer 2.2x deeper bear-market drawdowns and frequent dividend cuts compared to broad VYM or FCF-screened SCHD? Unscreened yield-ranking overweights indebted utilities, office REITs, and shrinking legacy firms!
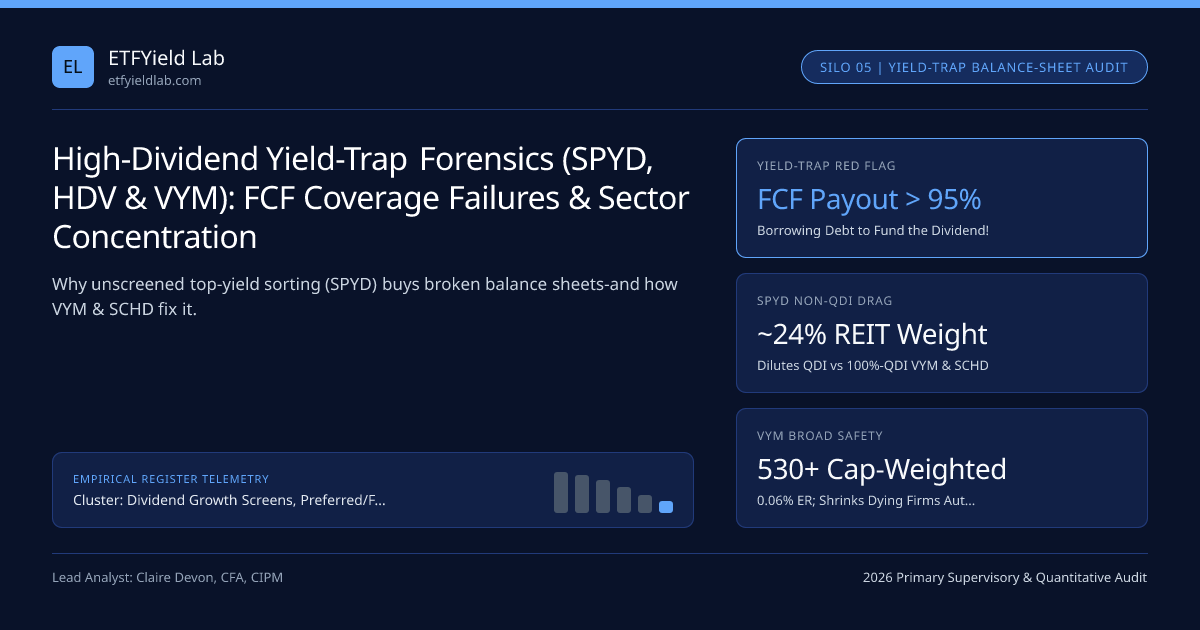
Every market cycle claims a fresh generation of dividend casualties—Walgreens, Intel, AT&T, Lumen, 3M, VF Corp, Medical Properties Trust—legacy household names whose trailing dividend yields soared from 3.5% to 7.5% right before management slashed the dividend by 50% to 100% on top of a -60% share-price collapse! Even worse, unscreened High-Dividend ETFs that rank stocks mechanically by trailing yield automatically buy MORE of those exact falling knives at every rebalance!
Inside our Dividend Growth & Credit Income Hub and Dividend & Credit Master Guide, pair this forensic yield-trap audit with our FCF/ROE dividend growth methodology guide (SCHD, DGRO & VIG) and QDI tax scorecard.
Anatomy of an Institutional Yield Trap: How Unscreened Indices Step on Landmines#
Follow the 4-stage death spiral of a classic S&P 500 Yield Trap—and contrast how unscreened yield-weighted SPYD reacts versus market-cap-weighted VYM and FCF-screened SCHD:
Look at Metric #2—why Vanguard High Dividend Yield (VYM, 0.06% ER) is vastly safer than equal-weighted SPYD: because VYM weights ~530 above-average dividend payers by Market Capitalization, a distressed company losing -60% of its market value automatically shrinks by -60% inside VYM instead of getting rebalanced back up to full weight!
Free-Cash-Flow Dividend Coverage & Debt-Adjusted Payout Formula#
How do institutional equity-income analysts screen any high-dividend ETF or individual stock in 60 seconds? By substituting Levered Free Cash Flow (FCF) for manipulated GAAP earnings:
- 1. True Free-Cash-Flow Payout Ratio (Must Stay <= 70% - 80% for Non-Regulated Corporates):
- FCFPayoutRatio = CashDividendsPaid / (OperatingCashFlow - CapEx - Preferred_Divs)
- 2. Debt-Funded Dividend Red Flag ("Negative Post-Dividend FCF"):
- DeficitFundedByDebt = CashDividendsPaid + NetBuybacks - FreeCashFlow > $0
- > Whenever FCFPayout > 100% for >= 6 quarters AND NetDebt / EBITDA > 3.5x:
- Historical 24-Month Dividend Cut Probability Exceeds 62%!
- Worked ETF Comparison Across 2020-2026 Full Cycle ($200,000 Taxable Investment):
- SPYD (Top 80 Equal-Weight S&P Yielders, 0.07% ER, ~4.3% Yield, ~24% Non-QDI REITs, 0 FCF Screen):
- Max Drawdown = -41.4% | Dividend Cut in 2020 = -18% | Lower QDI (~76%) -> Trails VYM & SCHD by >220 bps/yr!
- VYM (530+ Market-Cap High-Div, 0.06% ER, ~2.9% Yield, 100% QDI, 0% REITs):
- Max Drawdown = -28.1% | Steady Rising Payouts | Diversified Value Core!
Compare 15-year compounding of 0.06% VYM/SCHD against 0.35% SDY in our ETF expense ratio calculator and Dividend reinvestment calculator.
Comparing the 4 Major U.S. High-Dividend ETFs#
High-Dividend Portfolio Upgrade Matrix Across Custodians#
| Current Position | Institutional Upgrade Move | Fee / Tax Gain | Execution & Custody Rail |
|---|---|---|---|
Unscreened SPYD in Taxable Account | Swap to SCHD (0.06%) or VYM (0.06%) | Lifts QDI 76% -> 100%! | Commission-free at Fidelity / Schwab (SIPC) |
Overpriced Aristocrats (SDY @ 0.35% ER, NOBL @ 0.35% ER) | Swap to VIG (0.05%) + SCHD (0.06%) | Saves 29.5 bps/yr! | Check 20-year savings in ETF expense calculator |
| Chasing 7% Distressed Single Dividend Stocks | 70% VYM/SCHD + 30% SGOV (Taxable) or USHY/HYG (IRA) | Eliminates single-name wipeouts | Institutional execution at Interactive Brokers (SEC) |
| Defensive Bear-Market Value Tilt | Pair VYM with 25% HDV (0.08%, Distance-to-Default) | 0.065% Blended Fee | Verify after-tax cash in T-Bill/Tax Tool |
Golden Rule Against Yield Chasing#
Whenever an equity ETF or stock yields more than 2.5x the S&P 500 dividend yield without an explicit Free-Cash-Flow-to-Debt screen, Mr. Market is pricing an upcoming dividend cut—stick to SCHD and VYM (0.06% ER) and get any extra pure cash yield from risk-free SGOV!
Frequently asked questions
Why did equal-weighted high-dividend ETFs like SPYD crash -40%+ in early 2020 and cut distributions?
Because SPYD simply picks the 80 highest-yielding S&P 500 stocks with zero balance-sheet quality filter and equal-weights them! Entering 2020, SPYD was packed with leveraged mall/office REITs, department stores, cruise/travel names, and indebted energy firms—26 of its 80 holdings suspended or slashed dividends within 90 days!
Does SPYD qualify for 100% Qualified Dividend Income (QDI) like VYM and SCHD?
NO! Because SPYD includes S&P 500 Real Estate Investment Trusts (~22%-26% portfolio weight in REITs!), roughly 20%-25% of SPYD’s annual dividend fails QDI and is taxed as ordinary Section 199A REIT income—whereas VYM, SCHD, VIG, and DGRO exclude REITs and achieve ~99%-100% QDI!
Why does SPDR S&P Dividend ETF (SDY, Dividend Aristocrats) charge 0.35% ER when VYM charges 0.06%?
Legacy index licensing! SDY tracks the S&P High Yield Dividend Aristocrats Index (20+ consecutive years of dividend increases, yield-weighted) at a steep 0.35% ER—nearly 6x higher than Vanguard VYM (0.06%) and Schwab SCHD (0.06%), costing -$2,900 per $1M every single year for lower historical total return!
What 3 balance-sheet ratios expose an imminent dividend cut before it happens?
(1) Dividends Paid / Free Cash Flow > 90% over trailing 8 quarters, (2) Net Debt / EBITDA > 4.0x (for non-utilities) with rising interest expense, and (3) Credit Default Swap (CDS) or bond OAS trading at B/CCC distressed levels while equity investors still cling to the trailing dividend!
Publication record
- Published
- November 13, 2026
- Updated
- November 14, 2026
- Author
- Claire Devon, CFA, CIPM
- Review
- Review not recorded
- Automated fact check
- Passed in the stored pipeline record
- Source URLs
- 4 recorded
AI assistance recorded: anthropic/claude-opus-4.6. This field does not establish human review or source verification.
Academic & Institutional Attribution
Cite This Research & Embed Live Data Card
Standard academic & institutional research paper citation format.
Claire Devon, CFA, CIPM. (2026, November 14). High-Dividend Yield-Trap Forensics (SPYD, HDV & VYM): FCF Coverage Failures & Sector Concentration. ETFYield Lab. https://etfyieldlab.com/yield-guides/high-dividend-yield-trap-forensics-fcf-coverage-leverageRelated Dividend Growth Credit Income Etfs & Institutional Briefings
Explore Dividend Growth Credit Income Etfs Hub (20) →Dividend Growth Credit Income Etfs
Dividend Growth Screens, Preferred/Fallen-Angel Credit ETFs & Securities Lending Master GuideDividend Growth Credit Income Etfs
Qualified Dividend Income (IRC 1(h)(11) QDI) Scorecard Across Dividend, Preferred & Credit ETFsDividend Growth Credit Income Etfs
Institutional Securities Lending Revenue Splits (SEC Form N-CEN): Offsetting ETF Expense RatiosDividend Growth Credit Income Etfs
Preferred Stock ETFs (PFF, PGX & VRP): $25 Par Call Yield-to-Worst, Fixed-to-Floating & Bank RiskDividend Growth Credit Income Etfs
Fallen-Angel BB Corporate Bond ETFs (ANGL & FALN) vs Original-Issue Junk: Forced-Selling Alpha MathDividend Growth Credit Income Etfs
Senior Floating-Rate Bank Loan ETFs (BKLN & SRLN): T+7 Loan Settlement vs T+1 Rule 22e-4 LiquidityDividend Growth Credit Income Etfs
BDC ETFs (BIZD & PBDC): Payment-in-Kind (PIK) Income Quality, Non-Accruals & AFFE Fee DisclosureDividend Growth Credit Income Etfs
MLP Midstream Energy ETFs (AMLP) vs RIC <25% Wrappers (MLPX & ENFR): 21% C-Corp Tax Drag MathBroker Fees and Calculators
The Czech National Bank’s first DLT bond and the new physics of the digital korunaMarket Insights
Stablecoin Drain, ETF Outflows Leave Bitcoin 'Running on Empty'Market Insights
BlackRock Bitcoin ETF outflows hit $2B over nine sessionsMarket Insights
Market angst is driving investors into low-volatility stocks as AI trade stumbles
ETFYield Lab Data, Benchmarks & Contributor Records
CC BY 4.0 Open Data
Open Institutional Datasets (CSV / JSON) →
Download desk-compiled quantitative series & schemas.
2026 Reference Matrix
2026 Institutional Benchmarks & Thresholds →
Statutory capital, clearing, margin & rate conventions.
Editorial Records
Authors & Review Records →
View named contributors where those records are available.
Complete Index
Master Research & Dossier Archive →
Browse all published briefings by topic pillar & date.